
Gleason score 3+4 and others mapped in PathoPlatform
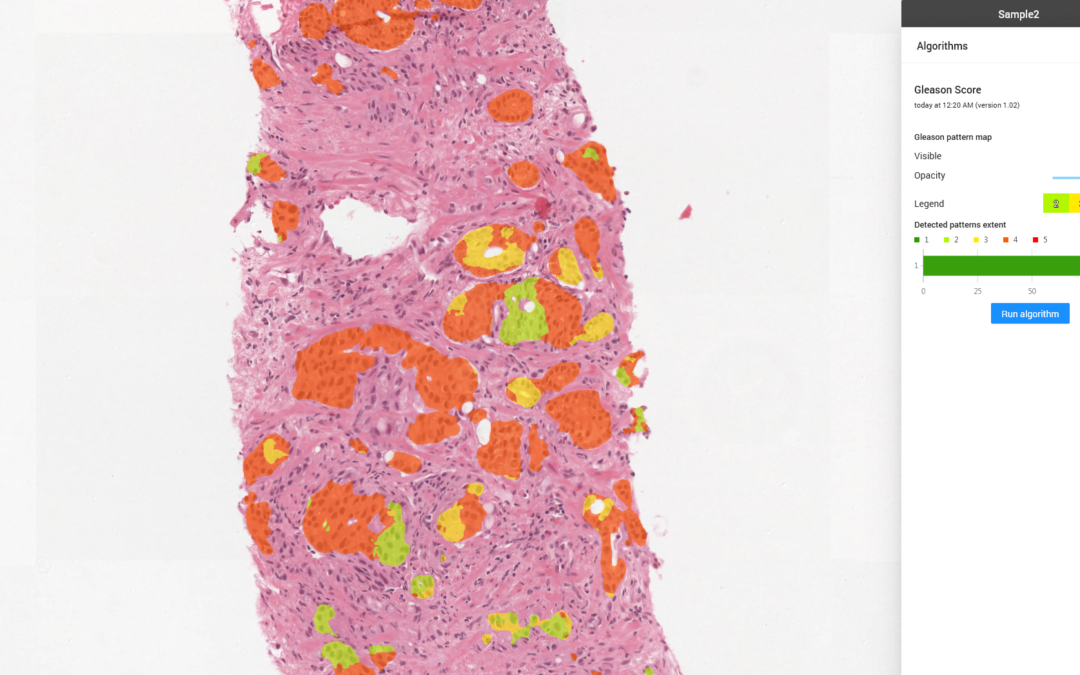
Run PathoPlatform to see how AI and deep learning can help pathologists make more accurate and faster diagnosis. To clarify, our developers team introduced new feature in the “Algorithm” tab. Pathologists can now not only run algorithm to count Gleason score, but also to draw a map of differently assigned areas. See example in the picture above.
What does Gleason score 3+4 mean?
In Gleason system numbers from 1 to 5 describe how much the cells in the cancerous tissue look like normal prostate tissue under the microscope. Grades 1 and 2 are not often used for biopsies − most biopsy samples are grade 3 or higher. Prostate cancers often have areas with different grades. A grade is assigned to the 2 areas that make up most of the cancer. These 2 grades are added to yield the Gleason score (also called the Gleason sum).
For example, Gleason 3+4=7 means that most of the tumor is grade 3 and less is grade 4.
Cancers with a Gleason score of 7 can either be Gleason score 3+4=7 or Gleason score 4+3=7. The first grading still has a good prognosis, while the second says that tumor is more likely to grow and spread.
Thus, in PathoPlatform areas with different grades are mapped with following colors:
- 1 = dark green
- 2 = pale green
- 3 = yellow
- 4 = orange
- 5 = red
Pathologist can choose proper Gleason score in Sample details → Report section.
Are Grade Groups included in PathoPlatform?
Grade Groups are a new way to grade prostate cancer to address some of the issues with the Gleason grading system.
As noted above, the Gleason grades range in theory from 2 to 10. But in practice the lowest number on biopsy is in the middle of the grade scale. This can make patients feel that they need to be treated right away. Another problem with the Gleason grading system is that the Gleason scores are often divided into only 3 groups (6, 7, and 8-10). This is not accurate, since Gleason score 7 is made up of two grades (3+4=7 and 4+3=7). Similarly, Gleason scores of 9 or 10 have a worse prognosis than Gleason score 8.
To account for these differences, the Grade Groups range from 1 (most favorable) to 5 (least favorable):
- 1 = Gleason score 6 (or less)
- 2 = Gleason score 3+4=7
- 3 = Gleason score 4+3=7
- 4 = Gleason score 8
- 5 = Gleason score 9-10
In PathoPlatform only areas with Gleason score grades are mapped with colors. However, the two systems are currently reported side-by-side. Thus they are both included in Reports section in PathoPlatform.